Quality View Analysis

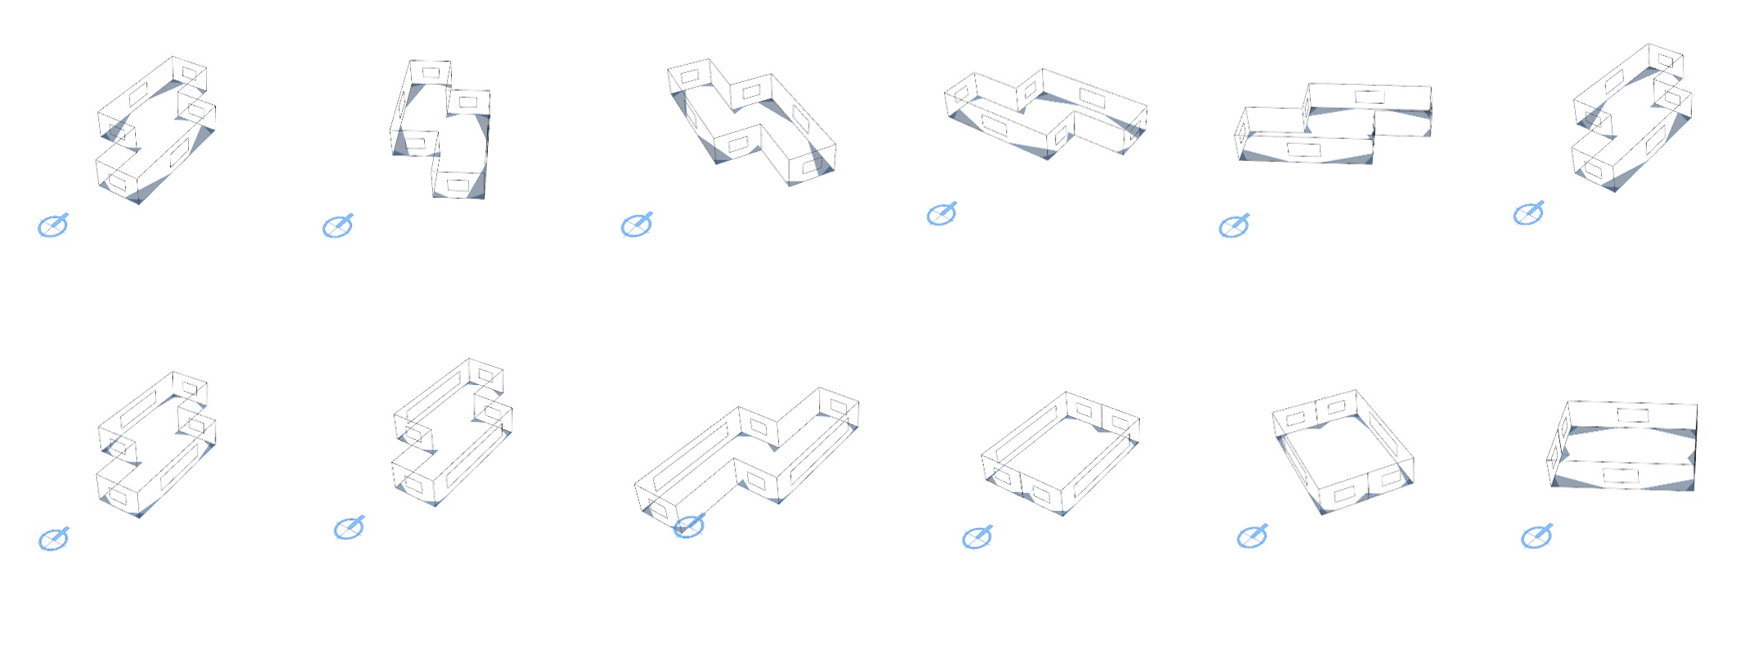
Figure 5.1: View quality analyses of different design alternatives
The purpose of View Quality analysis (Figure 5.1) is to assure the connection with the outdoor environment. This analysis entails two indicators: The Direct Line of Sight (DLS) that calculates the percentage of the floor area of the building with exterior view, and the Quality View (QV) that calculates the percentage of the area that allow the view of some relevant elements of the landscape. These two indicator are based on the Chapter Indoor Environmental Quality from the Guide for Building Design and Construction LEED V4 (Updated July 1, 2014).
Resources
| Resource | Description | Weblink | |
|---|---|---|---|
| GH file | Sprout Space GH View Quality Analysis Definition | Download |
Quality View Analysis Process
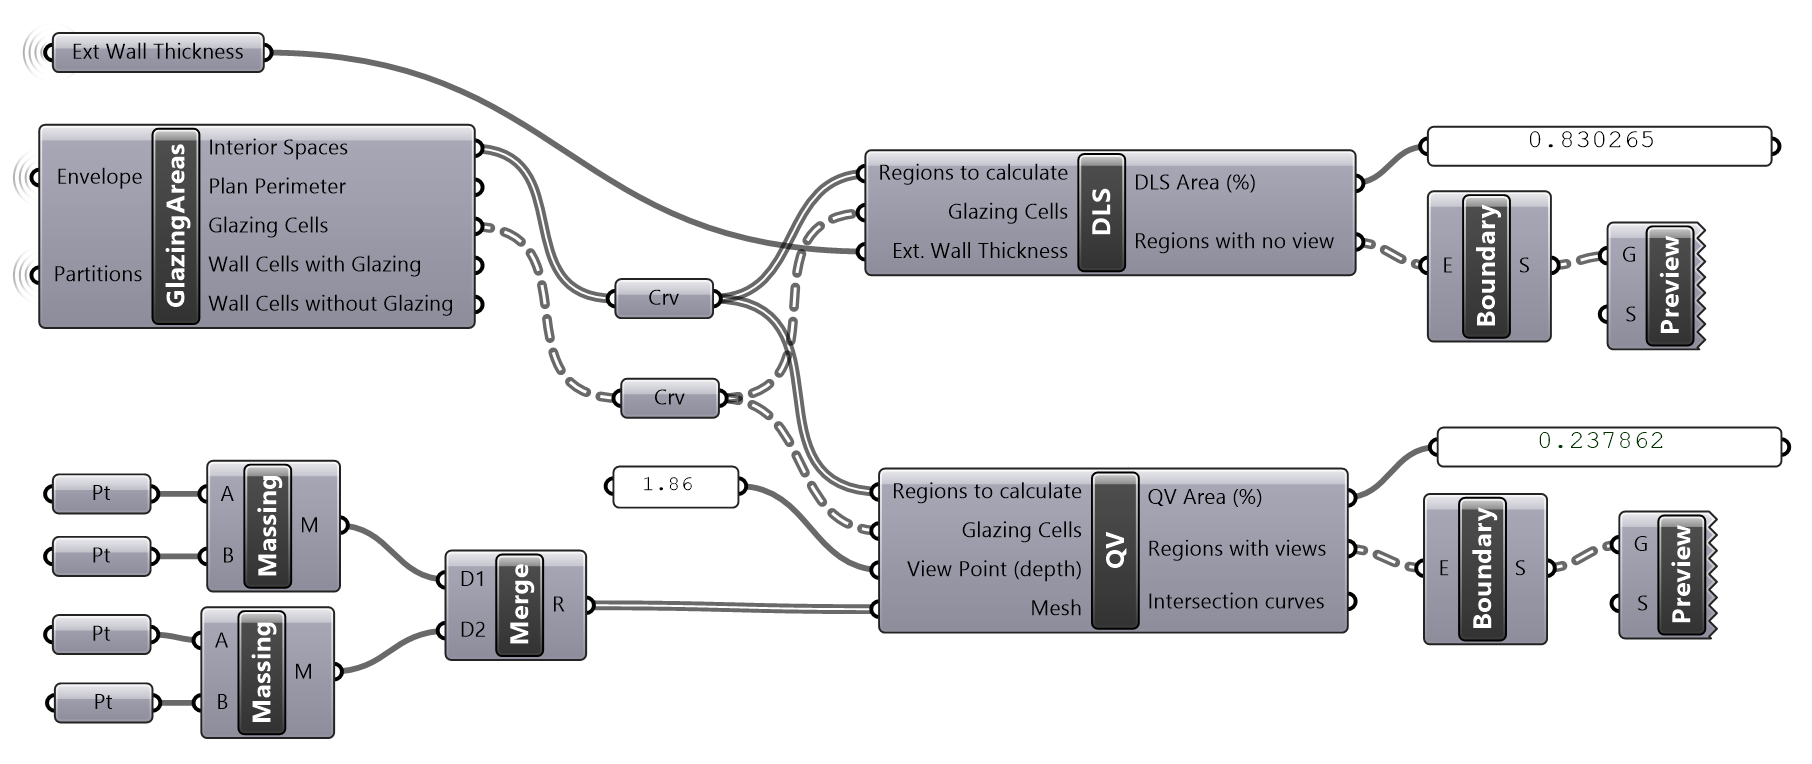
This analysis (Figure 5.2) takes the building envelope components as inputs, and discriminate between opaque and glazing surfaces to calculate the two different indicator: DLS and QV.
 Figure 5.2: Quality view workflow and main components
Glazing and Opaque Areas
The custom GlazingAreas component distills the glazing regions of the envelope that constitute the main input to calculate the DLS and the QV indicators. It takes in the geometry of the envelope, including wall, window, and interior partition geometry to identify the interior spaces, the plan perimeter, the glazing cells or surfaces, and the opaque walls with and without windows.
The Glazing Cells
The notion of Cells in this model refers to a well-oriented square surface that represents a glazing surface (Figure 5.3). The purpose of the Cell Curve object
is simply to ensure that curves are consistent in their orientation, so that downstream operations are reliable. A Glazing curve is a Curve element that indicates the perimeter of such a surface. Curves are used instead of surfaces to reduce processing time. Similarly, a Wall curve indicates the perimeter (in elevation) of a Wall surface.
Determining which Wall each Glazing surface is nested on is done by geometrically matching three conditions:
- Match cell curves by containment.
- Match cell curves by containment in Z axis.
- Match cell curves by plane normals.
When all three methods return a value of True, this means that a Glazing curve has been matched to a Wall curve. These tasks are executed by the GlazingAreas cluster component that embeds robust methods to assess and validate the geometry of the model and distill the glazing areas to perform the DLS and QV evaluations.

Figure 5.3: Glazing areas
The Plan Perimeter
The plan perimeter is also derived from the GlazingAreas cluster component. It is used to calclulate the QV and DLS ratio.
Direct Line of Sight (DLS) Indicator
The Dark Areas
The extent of glazing, as viewed in plan, is used to determine the 'areas with no views'. This concept is taken from LEED 4.0:
"Achieve a direct line of sight to the outdoors via vision glazing for 75% of all regularly occupied floor area. View glazing in the contributing area must provide a clear image of the exterior, not obstructed by frits, fibers, patterned glazing, or added tints that distort color balance."
T he method that calculates the floor area, is taken from LEED 2009 IEQ Credit 8.2 Daylight and views. In this method, the plan view angle through the glazed area considers the actual wall thickness for punched windows. In plan, two diagonal lines are drawn, one connecting the exterior left wall opening corner to the interior right wall opening corner, and the other connecting the exterior right wall opening corner to the interior left wall opening corner. This is done for each glazed opening. These two diagonal lines are extended towards the interior. Wherever diagonal lines of adjacent windows intersect, the area contained within these diagonal lines and the associated wall or walls is regarded as an 'area with no view' or dark area (Figure 5.4). The DLS indicator of this case study is 0.830265, or 85%, which is above the recommended reference of 75%.
 Figure 5.4: Process of computing the dark areas of the building
Quality View (QV) Indicator
2D Visual Fields
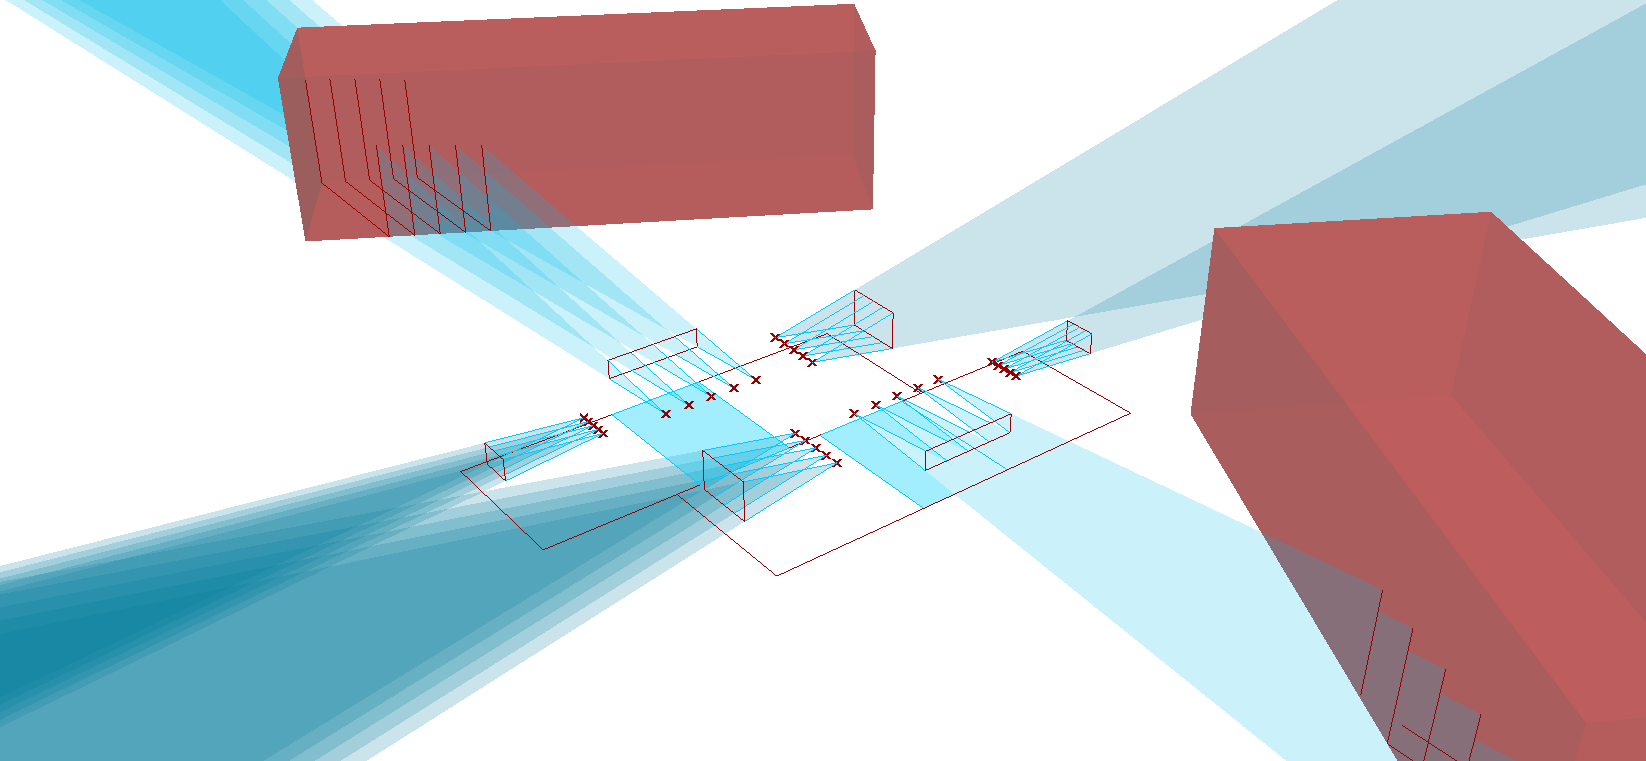
DLS assures people can see out of the building, but this says nothing about the quality of that view. The QV indicator is inspired by the Quality View definition in LEED V4. It is based on a two dimensional interpretation of the building. It represents a 2D viewing angle from each sampled view point inside the building, as it would be represented in a section (Figure 5.5), and computes the intersection of these 2D fields with relevant elements of the landscape (Figure 5.6).

Figure 5.5: Process of computing the 2D viewing angles
Refer to the Guide for Building Design and Construction LEED V4 (Updated July 1, 2014) Chapter: Indoor Environmental Quality EQ Credit Quality Views, and see examples on pages 750-751 for more information.
Landscape Evaluation
For the purpose of this case study, the triangular meshes representing the 2D viewing angles are used to intersect elements in the context model of two buildings masses of visual interest(Figure 5.6). When an intersection is found, it is counted towards a quality view area, represented as a blue area on the center of the space. This methods requires a mesh representation of the relevant elements of the landscape. The QV indicator of this case study is 0.237862 that corresponds to almost 24% of the floor plan area of the building.
 Figure 5.6: Computing and mapping in plan the intersection of the viewing angles with relevant elements of the landscape